Bearish Flag Chart Pattern Strategy – Quick Profits In 5 Simple Steps
Today’s trading strategy is about one of the most reliable continuation patterns, the Bearish Flag Pattern. Our bear flag chart pattern strategy will give you a framework to conquer market trends.
Our team at Trading Strategy Guides is working hard to put together the most comprehensive guide on different bearish flag chart pattern strategies. In order to understand the psychology of a chart pattern, please start here: Chart Pattern Trading Strategy step-by-step Guide.
One of the first experiences most day traders learn when they start trading is price action trading. One of the most popular price action patterns you may have heard of is the bear flag pattern.
The bearish flag is a very simple continuation pattern that develops after a strong bearish trend.
It doesn’t really matter if your preferred time frame is the 5-minute chart or if you prefer a long-term chart. The bear flag pattern shows up with the same frequency on all time frames.
A continuation pattern, like the bearish flag, brings some good news because it tells you after the market has gone down, that it will continue to go down even more.
If you missed the initial sell-off, the market has gone without you, and you spot the bear flag pattern on that chart, this is a sign and a safe place to sell so you can enjoy the rest of the bearish trend.
We’re also going to provide you with a very clear step-by-step set of rules so you can trade the Bear Flag chart pattern strategy by yourself.
Moving forward, we’re going to discuss what makes a good bear flag pattern. We will highlight five basic trading rules to conquer the markets with the Bear Flag chart pattern strategy. You can also read the simple yet profitable strategy.
What is a Bearish Flag Pattern?
A bear flag pattern is constructed by a descending trend or bearish trend, followed by a pause in the trend line or consolidation zone. The strong down move is also called the flagpole while the consolidation is also known as the flag.
In other words, the bearish flag chart pattern is made up of two elements:
- First, the flagpole, which is always pointing downwards
- And, second, the flag component
Now…
You’re probably wondering:
“What does a bearish flag look like?”
See the chart below:
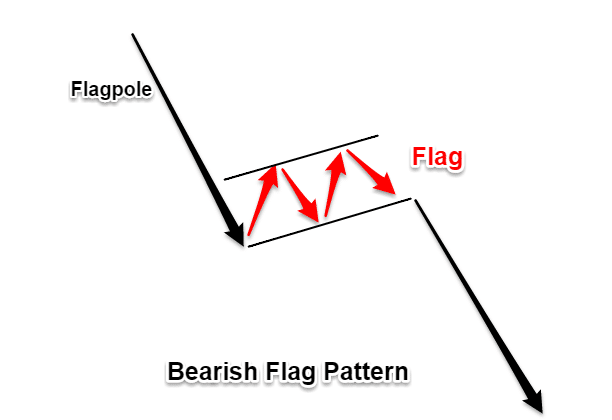
The bear flag pattern comes after a strong move downwards. The stronger the move, the bigger the profit potential is.
As you can see in the figure below, after the market makes a strong down move, it enters into consolidation – a very narrow range – to adjust to the new lower prices.
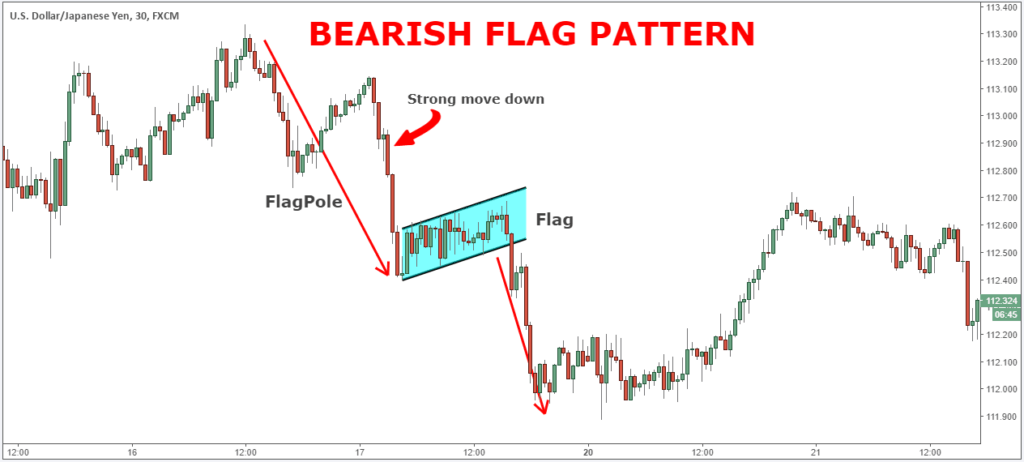
Note* For a valid bearish flag the support and resistance lines forming the flag needs to be parallel and often will be sloping upwards.
The bearish flag pattern has some similarities with the Rectangle Chart Pattern. The difference is within the rectangle pattern, the price action is moving horizontally in a much bigger trading range. Additionally bear flag patterns can sometimes be confused with Megaphone Chart Patterns, although Megaphone patterns can contain elements of a bear flag inside it.
Next…
Let’s see how to trade the bearish flag pattern like a pro.
How to Trade a Bearish Flag Pattern?
The potential sell signals generated by the bear flag are straightforward.
The best trade entry is when the price breaks below the flag.
See the bear flag example below:
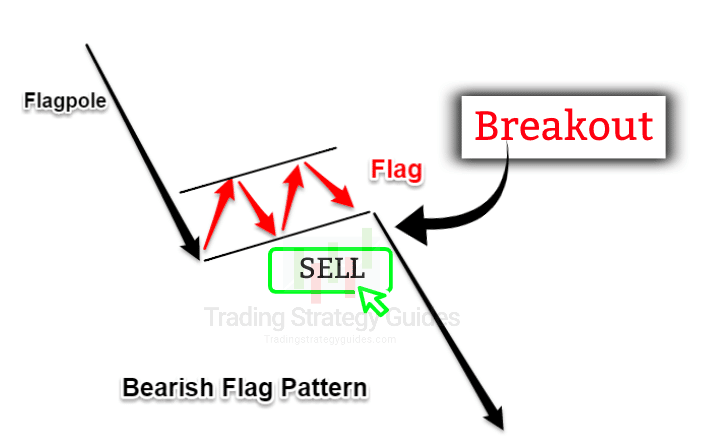
The breakout of the flag signals that the downtrend is ready to resume.
Bear in mind that the small consolidation aka the flag is a period of pause or correction in the bearish trend. Typically, the price should not retrace more than 50% of the pole.
Now…
The truth about trading chart patterns is that they come in many different sizes. So, no two bear flag patterns will look the same – there will always be some slight variations.
Now, when the price moves in the opposite direction – meaning the flag pole is pointing upwards, we have the bull flag chart pattern, which is the opposite of the bear flag.
See below the differences between the bull and bear flag formations.
Bullish Flag Pattern vs Bearish Flag
A bull flag is similar to a bear flag except the trend direction is upwards.
The bullish flag formations can be recognized by a strong uptrend followed by a pause in the trend that has the shape of a flag.
See the bull flag pattern example below:
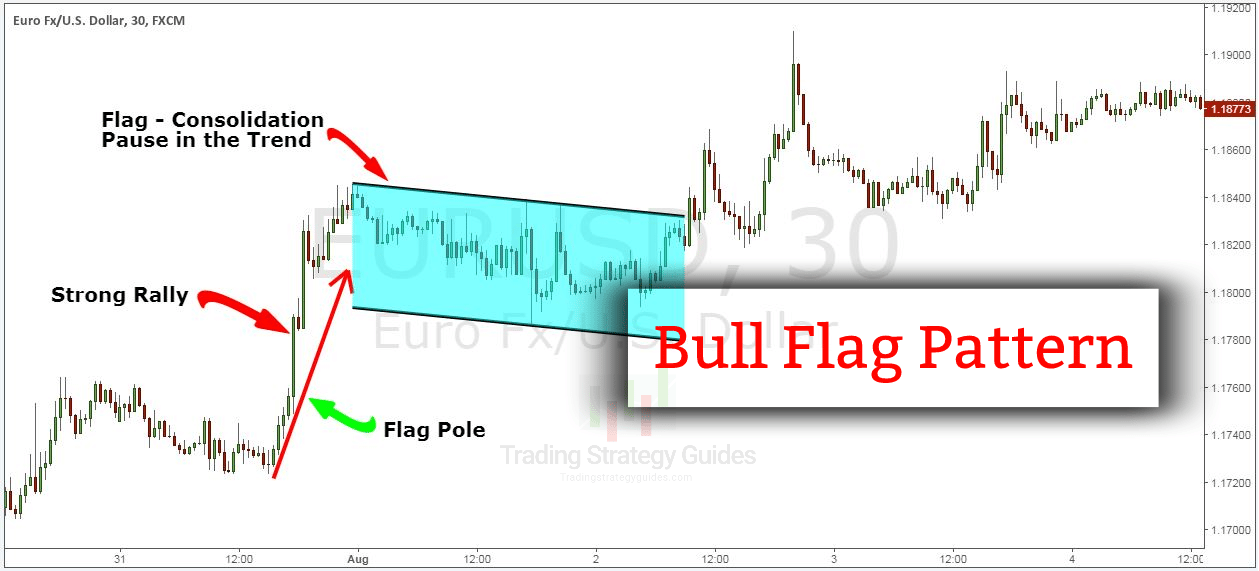
So, you simply turn upside down the bear flag and you get the bull flag.
If you want to learn how to trade the bullish flag pattern like a pro, please check our guide HERE.
Moving forward…
Let’s see when the best time to trade the bear flag is.
When Should You Trade the Bear Flag Pattern?
The ideal time to trade the bear flag is after the price breaks a support level.
The basic method of trading breakouts of support and resistance levels is to sell as soon as we break below support and buy as soon as we break the resistance level.
This trading approach is not without flaw.
Let me explain:
Chasing prices lower after a breakout hoping to catch a piece of the action is always a bad idea, for several reasons.
First, you risk selling the low of the day, because you’re selling after the price has already moved significantly lower. And, secondly, the risk to reward ratio of such trades is always skewed against the trader.
So, you have two strong reasons not to take the breakout.
If you still want to capitalize on the volatility that results from a breakout, a better approach is to wait for the bear flag to show up on the price chart.
See the chart below with an example:
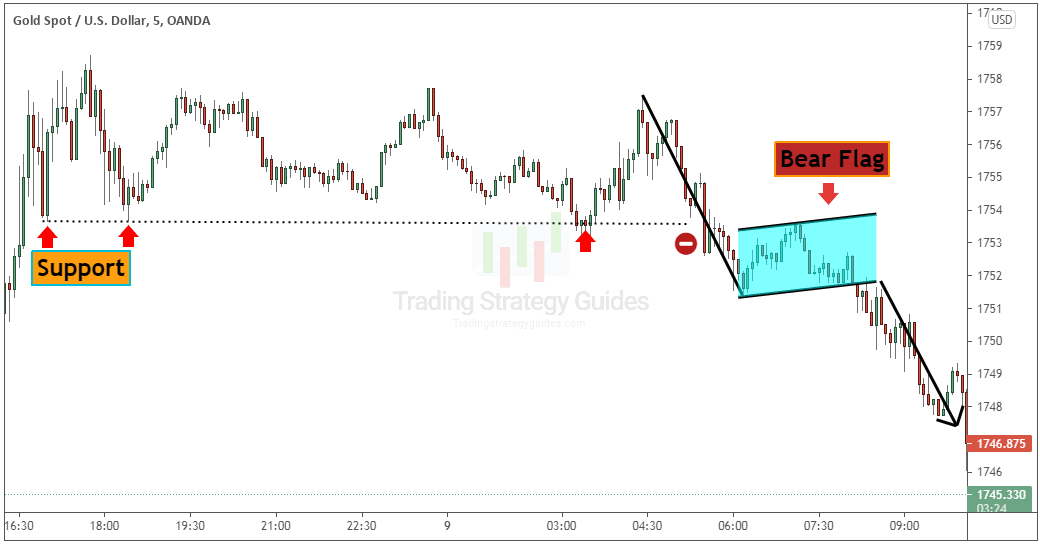
The bear flag formation offers trades with promising risk-reward ratio and clear entry and exit points.
Now, the downside is that you’re going to miss some of these breakouts if the bear flag doesn’t develop on the price chart.
In this case, you can always use this breakout trading strategy and discover how the pros trade breakouts.
In the next section, you’ll discover what is going on behind the scene.
Read on…
The Psychology behind Bear Flag Pattern
The bear flag pattern highlights a trading environment where the supply and demand balance has shifted badly in one direction of the market (supply > demand). In turn, this will produce very little upside retracement, which allows the flag structure to take shape.
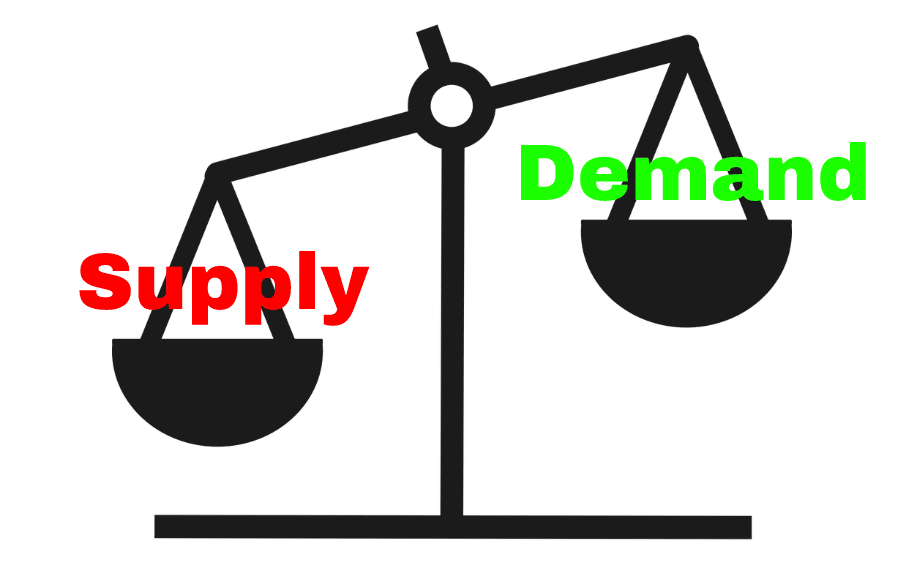
After the initial selloff, people who missed the train will panic and begin selling. More people will sell it during the flagpole stage.
During the pause or the narrow consolidation, people wait to get a higher price so they can sell. But since the supply and demand equation is so imbalanced, this won’t happen. We get another smash that will make many people chase the move to the downside again.
Now, let’s see how you can effectively trade with the Rectangle chart pattern strategy and how to make profits from basically using naked charts. You can also read about stop loss forex for better trading.
Bear Flag Pattern Strategy – Sell Rules
Now that you’re familiar with the bearish flag formation, let’s walk through an easy step-by-step guide. It will frame an easy trading strategy for you to skim the markets.
The best thing about the bear flag pattern is that there’s a very easy way of knowing how low it will send the currency price.
We’ve done something different with the Bear flag chart pattern strategy. We’re going to teach you a new way on how to trade the bearish flag.
Now is the time to go through the bear flag chart pattern strategy step-by-step guide:
Step #1: Look for evidence of a prior bearish trend. For a valid bearish flag, you need to see a sharp decline.
Just because you can spot the bear flag pattern, doesn’t mean you have to jump straight into the market and trade it.
Remember, we need the right context and the right price structure needs to line up for a tradable bearish flag.
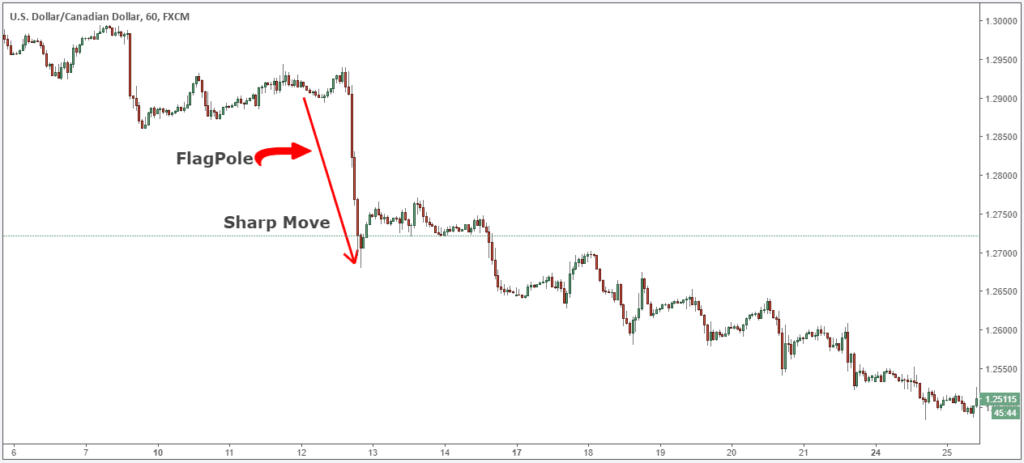
So, the first step is to identify the market trend prior to the flag price formation.
First, a valid bearish flag needs a sharp decline. This is strong evidence of a bearish trend and that the supply and demand is out of balance.
Note* The sharp move is also the Flagpole – the first element of the bearish flag structure.
Step #2: Identify the flag price formation. The price action needs to move in a narrow range between two parallel lines.
The flag price formation is the second element of the bear flag pattern. The bearish flag is very similar to a bearish triangle and that pattern at times may be used instead of a bearish flag.
Basically, all you need to do is to spot one support and one resistance level. It must contain the price action in a very narrow range.
The narrow range is key for the bear flag pattern success rate.
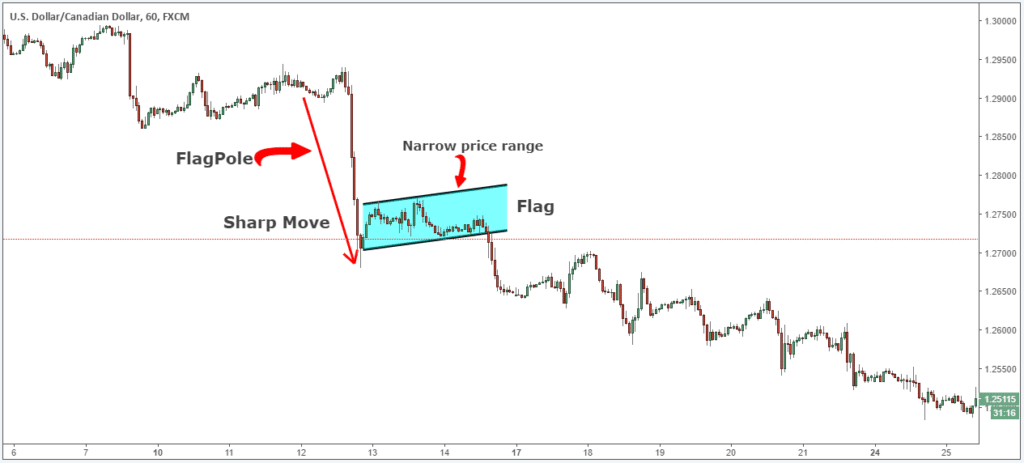
So far, so good.
Now, we need to determine an entry technique for our bear flag pattern strategy.
See below:
Step #3: Sell at the closing candle that generates the Flag Breakout.
After we identify the market trend and the characteristics of a good bearish flag pattern we need to wait for confirmation that the trend is about to resume.
There are two basic approaches to enter the market with the bear flag pattern. Aggressive traders will enter at the top of the bearish flag as this will secure a little bit of bigger profits.
If you’re a conservative trader you can wait for confirmation provided by the flag breakout.
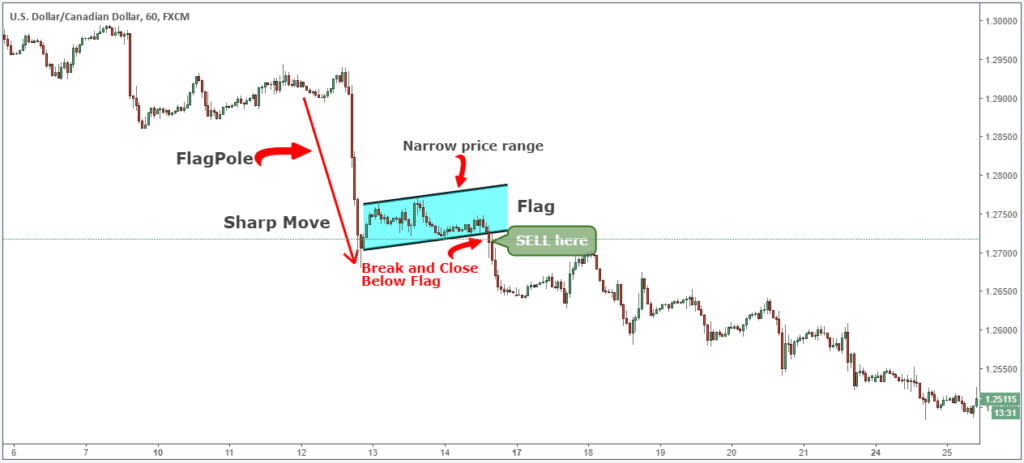
Our team at TSG prefers to take the conservative approach and wait for a break and close below the bearish flag before executing the trade.
The bear flag chart pattern strategy only looks for trading opportunities when you get a breakout below the flag price structure to be a seller.
The next important thing we need to establish is where to place your protective stop loss.
It is important when looking at this type of strategy to keep everything in the context of the overall market. Too many traders will try to zoom on
See below…
Step #4: Place the protective stop-loss slightly above the Flag.
The Rectangle chart pattern strategy gives you a simple way to quantify risk because you can place your protective stop-loss slightly above the flag price structure.
We’re accomplishing two things with our tight stop loss:
- Small losses.
- Higher risk to reward ratio.
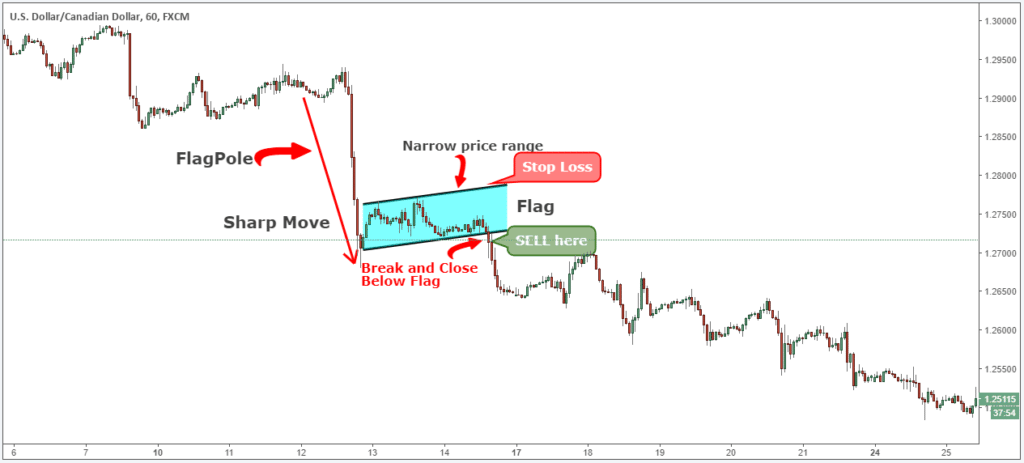
With such a tight stop loss you’ll have the comfort of losing many trades in a row because with the amazing RR the bearish flag can potentially wipe out all your losses in a single trade and still come profitable.
The next logical thing we need to establish for the bear flag pattern strategy is where to take profits.
See below…
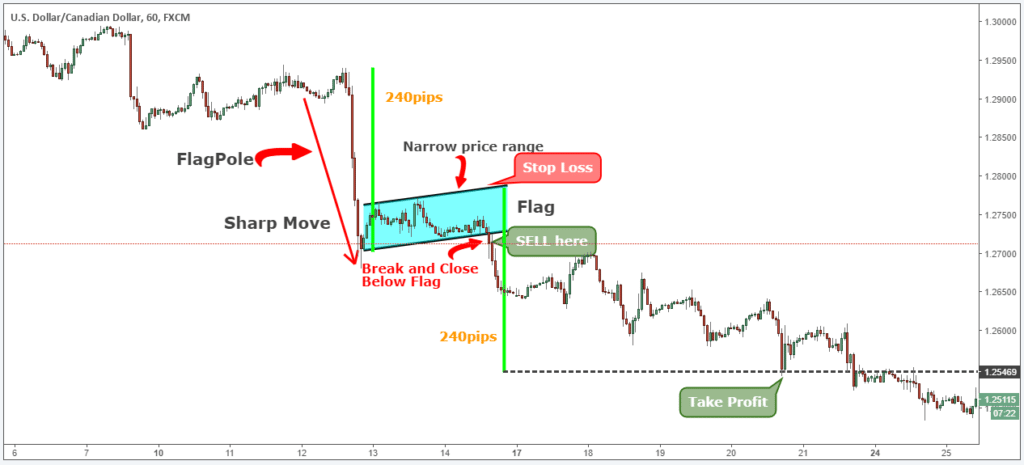
Step #5: Take Profit target equals the same price distance of the Flag pole measured down from the top of the bearish flag.
The textbook profit target is the height of the flag pole measured down from the top of the flag.
Our team at TSG has learned that the market likes this kind of price symmetries and we like to take advantage of it.
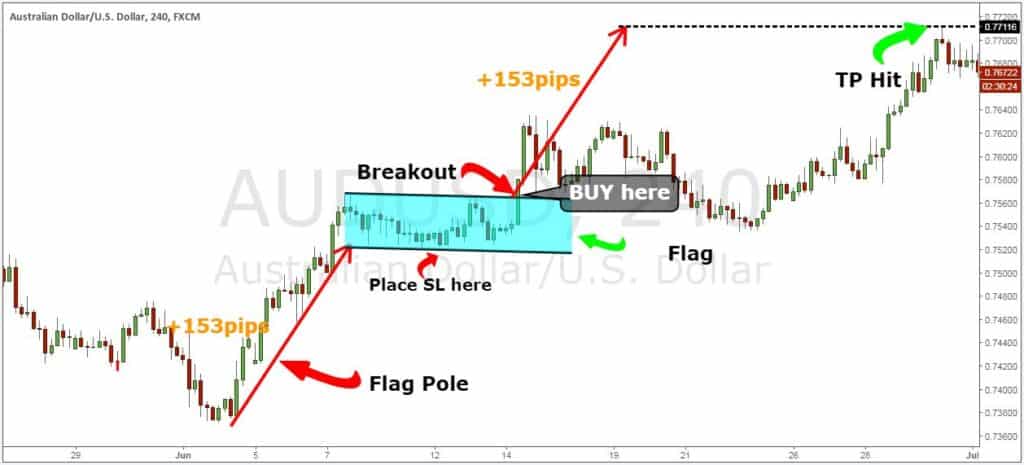
Note*** The above was an example of a SELL trade… Use the same rules – but in reverse – for a BUY trade, but this time we’re going to use the bullish flag, or bull flag. In the figure below, you can see an actual BUY trade example, using the bullish flag pattern.
A Deeper Look at the Bear Flag Pattern
The bear flag is one of the most powerful continuation patterns you’ll see in a downtrend. At first glance, it might look like just a pause in the market, but when you break it down, it tells a very clear story: aggressive sellers, a moment of relief, and then another wave of downside. To trade it correctly, you need to understand each piece of the setup.
Anatomy of the Bear Flag
- The Flagpole
Every bear flag starts with a strong, almost vertical drop. This move should stand out on your chart—it’s the sign that sellers are firmly in control. High volume during this stage is critical. It confirms that the downward move isn’t just noise, but real conviction. - The Flag
After the big drop, price doesn’t just keep sliding. It takes a breather. You’ll often see a tight channel that slopes slightly upward or moves sideways. Think of this as the market catching its breath before continuing lower. During this phase, volume usually dries up, which is another clue that the move is only pausing, not reversing. - Proportions Matter
A common mistake traders make is mislabeling any pullback as a flag. A true bear flag doesn’t retrace too far—ideally less than 38% of the initial flagpole. If the retracement is deeper than that, you may be looking at a reversal setup instead.
Confirmation Tools to Strengthen Your Setup
Bear flags work best when you combine them with other tools:
- Volume Analysis: Look for heavy selling on the pole, lighter volume in the flag, and then a surge on the breakout.
- Fibonacci Levels: The 38.2% and 50% retracements often line up with resistance inside the flag. If price stalls there, it adds credibility to the pattern.
- Indicators: Momentum tools like RSI or MACD can confirm that strength is fading during consolidation. A rejection near the 50-period moving average can also act as added confirmation.
- Multi-Timeframe Analysis: Spotting the pattern on a lower timeframe is good, but if the same structure appears on a higher timeframe (like daily or weekly charts), it carries much more weight.
How to Trade the Bear Flag
- Entry: The cleanest entry is when price breaks and closes below the lower trendline of the flag. Conservative traders wait for a full candle close; aggressive traders might place a stop order slightly below support.
- Stop-Loss: You can place a tight stop just above the upper boundary of the flag, or give it more room by setting it above the recent swing high. Using an ATR-based stop is another way to adapt to volatility.
- Profit Target: The textbook target is simple—measure the height of the flagpole and project that distance down from the breakout point. Many traders also scale out early, locking partial profits in case of a reversal.
Avoiding Traps and False Breakouts
Bear flags don’t always play out. A failed bear flag happens when the price breaks down but quickly reverses back into the channel. This is known as a bear trap and can be costly if you’re not careful. To reduce the risk:
- Always check volume on the breakdown. If volume doesn’t expand, the breakout may be weak.
- Look for candlestick confirmation, such as a strong bearish engulfing candle at the start of the move.
- Keep an eye on market context—bear flags that form near strong support zones are more likely to fail.
The bear flag isn’t just about spotting a shape on the chart it’s about recognizing the rhythm of the market. A strong wave of sellers, a short pause, and then a continuation of the trend. By combining the pattern with tools like Fibonacci, volume, and momentum indicators, you can dramatically increase your odds of success. And just as importantly, by planning your stop and profit targets in advance, you protect yourself against traps when the market doesn’t play along.
Final Thoughts – Bearish Flag Pattern
Identifying the bear flag pattern should be an easy job but if you have the right trading conditions the bearish flag can be a great trading pattern to start growing your account. The key thing about the bear flag chart pattern strategy is that it’s a strategy that works only in a bear market and it works beautifully.
Please also don’t forget to check out our previous strategy tutorial on trading channel pattern strategy.
Thank you for reading!
-The TSG Team