Lecture 6: Timeframes for SMC Traders – Multi-Timeframe Analysis and the Top-Down Approach
In Smart Money Concepts (SMC), understanding how to analyze different timeframes is essential. Unlike strategies that rely solely on one chart period, SMC traders use a multi-timeframe approach to get a complete picture of the market. This lesson will explain what multi-timeframe analysis means, why it is important, and how to implement a top-down approach effectively. The goal is to ensure that beginners understand how different timeframes work together to provide insights into institutional trading strategies.
The Concept of Multi-Timeframe Analysis
Multi-timeframe analysis involves looking at the market through several different periods to understand both the bigger picture and the finer details. Think of it as examining a landscape with both a wide-angle view and a close-up lens. When you analyze a higher timeframe, such as a daily or 4-hour chart, you see the broader trends and major support and resistance areas that institutions focus on. Conversely, lower timeframes, such as the 15-minute or 5-minute charts, reveal the more immediate price action and entry opportunities.
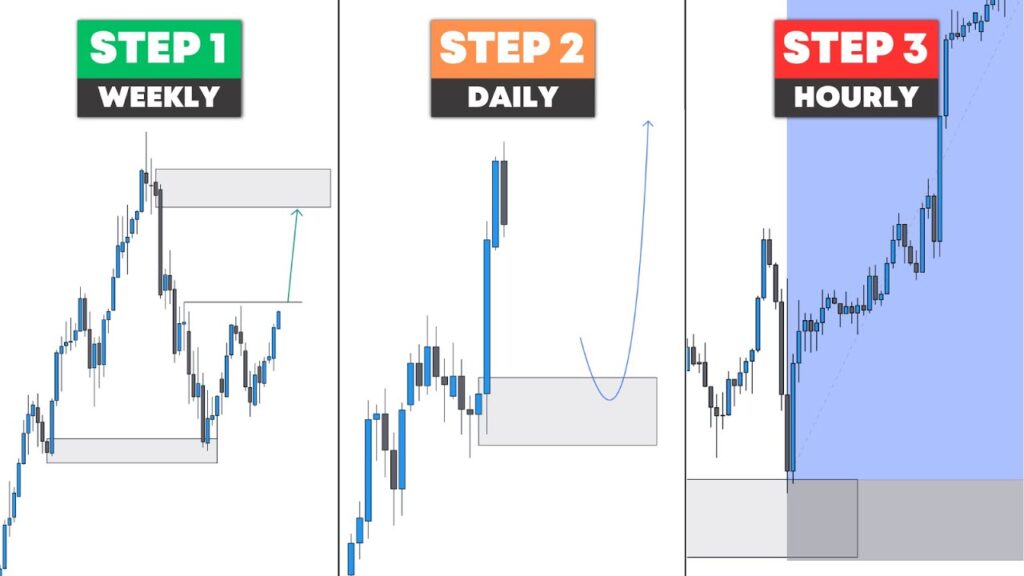
For example, a trader might start by looking at a daily chart to determine whether the overall trend is bullish or bearish. Then, they might move to a 1-hour chart to identify specific supply and demand zones or order blocks. Finally, a glance at a 15-minute chart can help pinpoint the best moment to enter or exit a trade based on short-term price movements.
What is the Top-Down Approach?

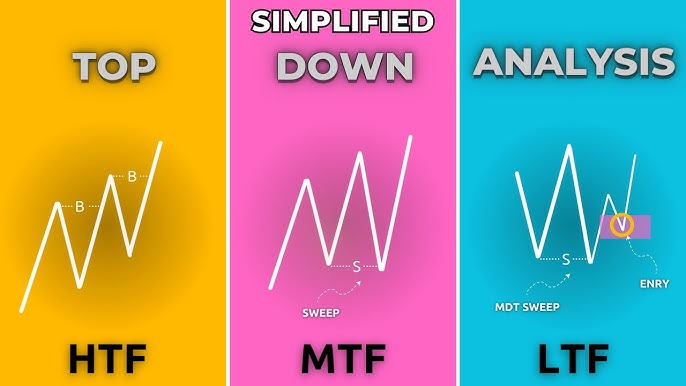
The top-down approach is the method by which traders start their analysis from the highest relevant timeframe and work their way down to lower timeframes. This ensures that all trading decisions are made in the context of the overall market structure and the strategic zones established by institutional players. The process typically follows these steps:
- Identify the Market Trend on a Higher Timeframe:Begin by analyzing a higher timeframe (like the daily or 4-hour chart) to understand the primary trend and major structural levels. These levels include significant swing highs, swing lows, and key support and resistance zones where Smart Money has likely placed large orders.
- Define Key Zones and Structures:Once the trend is identified, mark important zones, such as supply and demand areas, order blocks, and significant breaks in market structure. These zones form the basis for understanding where institutional traders have acted in the past and may act again.
- Drill Down to Intermediate Timeframes:After establishing the broader market context, switch to an intermediate timeframe (such as the 1-hour chart) to refine the analysis. Here, you can observe how the price reacts when it approaches the key zones defined on the higher timeframe. This helps in identifying points where price action begins to show signs of reversal or continuation.
- Fine-Tune with Lower Timeframes:Finally, use a lower timeframe (like the 15-minute or 5-minute chart) to pinpoint precise entry and exit signals. At this level, you focus on smaller price movements and patterns that indicate an optimal trade entry. The lower timeframe should be used solely for timing, while the overall decision-making is guided by the higher timeframe analysis.
Why Timeframes Matter in SMC Trading
Timeframes are the foundation of effective SMC trading for several reasons:
- Contextual Clarity:The higher timeframe provides context for the overall market direction, ensuring that you are not trading against the dominant trend. This helps avoid counter-trend trades that often result in losses.
- Enhanced Reliability of Key Zones:Zones identified on higher timeframes tend to be more reliable because they represent areas where institutional orders have been placed. Using multi-timeframe analysis confirms these zones on lower timeframes, increasing the probability of a successful trade.
- Improved Risk Management:By understanding where major structural levels lie on higher timeframes, you can set better stop losses and target levels. This alignment reduces the chance of being stopped out by temporary price fluctuations on lower timeframes.
- Avoiding False Signals:Relying on one timeframe might expose you to short-term noise that does not reflect the overall market sentiment. Multi-timeframe analysis filters out this noise and focuses on what matters from the institutional perspective.
Steps to Implement Multi-Timeframe Analysis

Let’s walk through a beginner-friendly process for applying the top-down approach:
- Start at the Highest Timeframe:Open your chart on the daily or 4-hour timeframe. Identify the main trend by looking at whether the price is making higher highs and higher lows (indicative of an uptrend) or lower lows and lower highs (indicative of a downtrend). Note any significant support or resistance zones that stand out.
- Mark Key Structural Zones:Draw horizontal lines or boxes around key areas where the price reversed sharply. These could be supply zones (areas where price dropped quickly) or demand zones (areas where price jumped rapidly). The zones identified here are likely where Smart Money has left its footprints.
- Move to an Intermediate Timeframe:Switch to a 1-hour chart to see how the price behaves around the key zones marked on the higher timeframe. Look for confirmation signals such as a Break of Structure (BOS) or a change in momentum when the price reaches these zones.
- Refine on a Lower Timeframe:Finally, open the 15-minute or 5-minute chart to time your entry. Look for specific price patterns or candlestick formations that indicate a strong reaction at the key zone. For example, if a demand zone is identified, you might look for a bullish engulfing pattern or a clear reversal candle as confirmation before entering a long trade.
Practical Example
Imagine you are analyzing a stock on the daily chart. You notice that the price has been in an uptrend, making higher highs and higher lows, and you identify a strong demand zone near a recent swing low. This zone is marked as an area where institutional buyers likely accumulated positions.
Next, you switch to the 1-hour chart and observe that when the price approaches this demand zone, there is a noticeable reaction: the price slows down and forms a small bullish candle before continuing upward. Finally, on the 15-minute chart, you spot a clear reversal pattern—perhaps a pin bar or a bullish engulfing pattern—right at the demand zone. With all these confirmations in place, you decide to enter a long trade, placing your stop loss just below the demand zone for added safety.
Common Mistakes to Avoid
One common mistake among beginners is relying solely on one timeframe. This approach can lead to a misinterpretation of the market’s overall trend, as the lower timeframes may show a different, more volatile picture. Another error is overcomplicating the analysis by switching between too many timeframes without a clear plan. It is important to establish a hierarchy: use higher timeframes for trend direction and key zones and lower timeframes only for entry timing.
Final Thoughts
The multi-timeframe, top-down approach is a powerful method for aligning your trades with institutional activity. By understanding the broader market context on higher timeframes and refining your entry on lower timeframes, you can improve both the accuracy and the effectiveness of your trades. This method not only enhances your ability to identify high-probability trade setups but also supports better risk management.
What’s Next
In the upcoming lecture, we will continue exploring practical applications of SMC by delving into “How to Mark Order Blocks Correctly.” This will build on what you’ve learned so far and further integrate your understanding of market structure with timing your trades accurately.
How useful was this article?
If you'd like to keep understanding how the Smart Money Trades, download this Cheat Sheet and learn the best Price Action Patterns.
Thank you for reading!
The Trading Strategy Guides Team