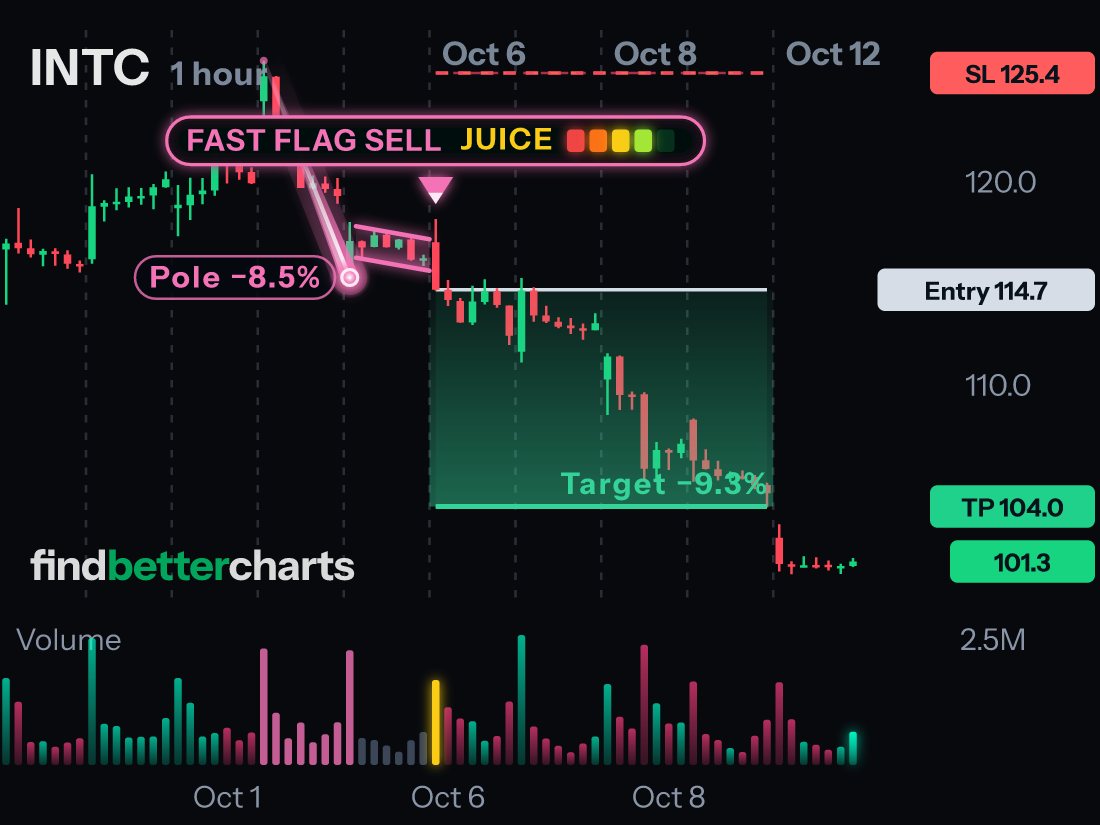
press play on this Intel chart
We built something you can play with.
On the FastFlags+ page there is a real Intel chart. Press play and it fills in candle by candle:
1. The surge. Intel drops 8.5% and the volume bars light up.
2. The chill. Six quiet candles. The volume dries up.
3. The Golden Flag. One gold bar on the break. FastFlags+ calls the sell.
4. The fast break. Three days later, the target.
Once you see the Golden Flag, you will never look at a flag the same way again.