Save $50 on our visual breakout indicator
I used to lose a lot of money trying to force directional trades when the market was actually just catching its breath.
The truth is that the market only does two things: it rests in a tight consolidation range, or it expands into a massive trend.
A massive percentage of retail losses happen because traders try to force action inside that resting phase, getting chopped to pieces before the real move even starts.
That is why we built a visual tool that automatically draws a box around this trapped institutional energy, so we know exactly when a breakout is real.
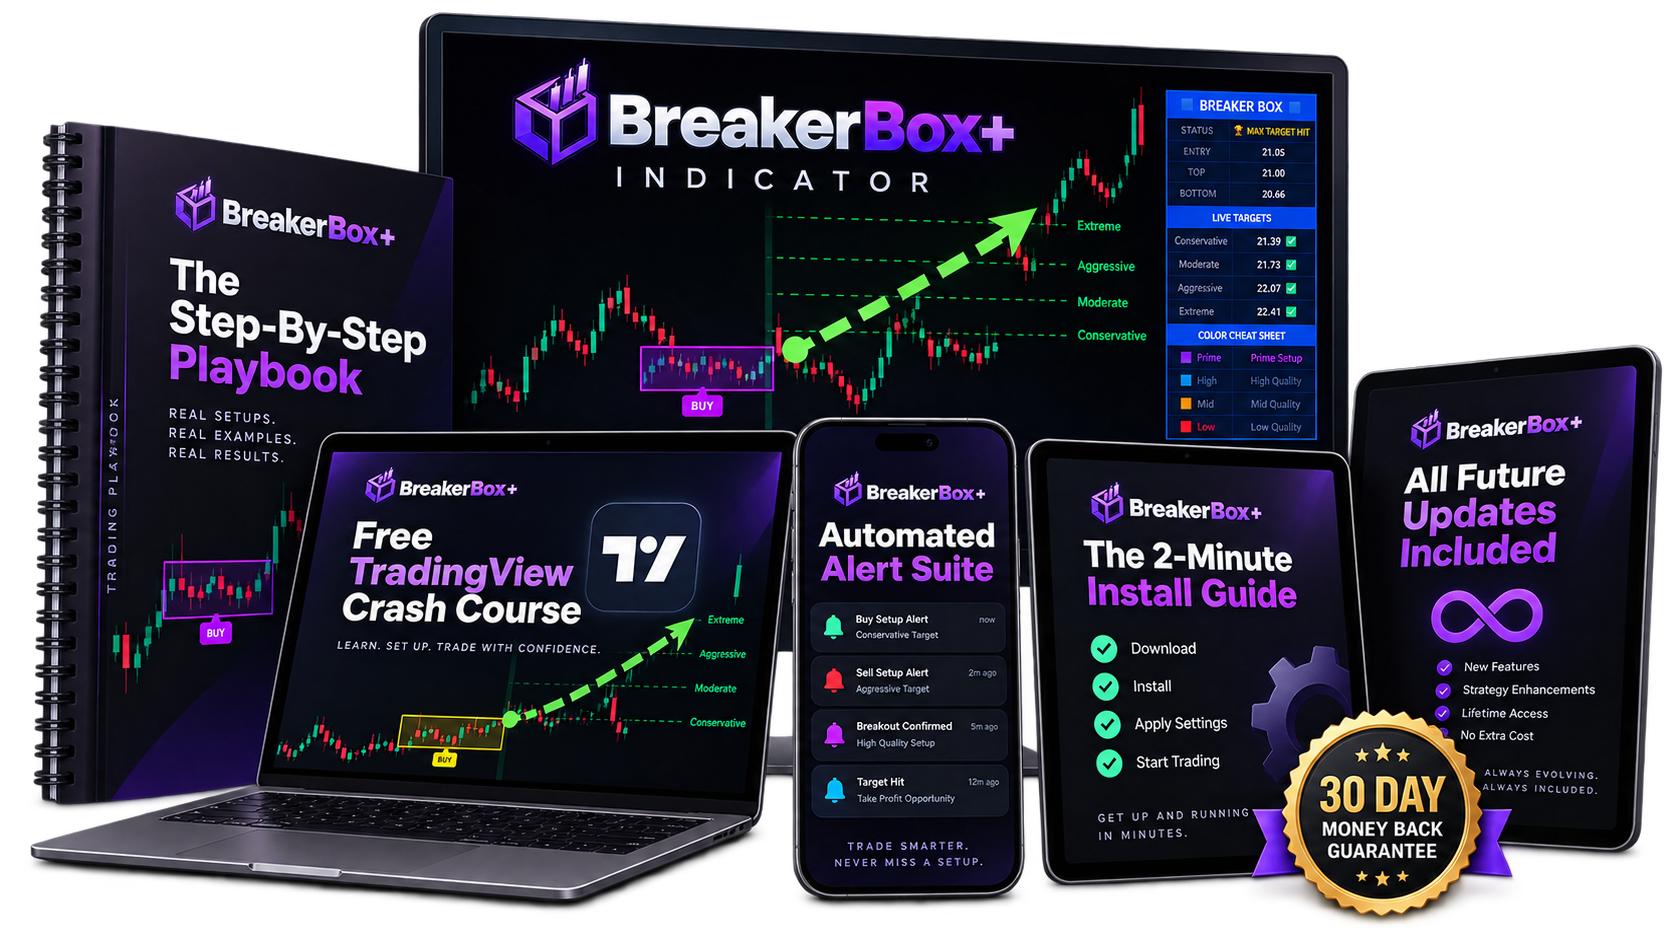
It is called the BreakerBox+ System, and it visually plots the resting range on your chart while instantly grading the setup quality from Prime down to Low.
Once the price breaks out of the box, the indicator fires a clear signal and automatically plots your exact take-profit targets based on the physical size of that range.
Whether you trade TSLA, Gold, or Bitcoin, this simple approach of waiting for the box to break keeps you on the right side of major institutional moves.
🔥 SAVE $50 WITH COUPON CODE "BOX" EXPIRING SOON!

You can use the coupon code BOX right now to save $50 on lifetime access, but this discount expires permanently this Sunday at midnight.
Get the BreakerBox+ System Here ➔
Hit reply and let me know: are you still trying to predict the next breakout manually, or are you ready to let the algorithm draw the ranges for you?
Talk soon,
Ben | Find Better Trades
P.S. If you want to see exactly how the algorithm automatically plots your target zones on TSLA and other major assets, click here to inspect the setup tiers before the coupon code expires on Sunday night.