how I map out institutional breakout zones
I wanted to make sure you had direct access to the entire BreakerBox+ blueprint without any of the usual gatekeeping.
I recently sat down and recorded a complete, uncensored strategy breakdown of how this system spots and trades high-velocity breakouts.
You can stream the on-demand masterclass right now without needing to wait for a scheduled webinar or registration timer.
Click here to watch the free strategy breakdown immediately.
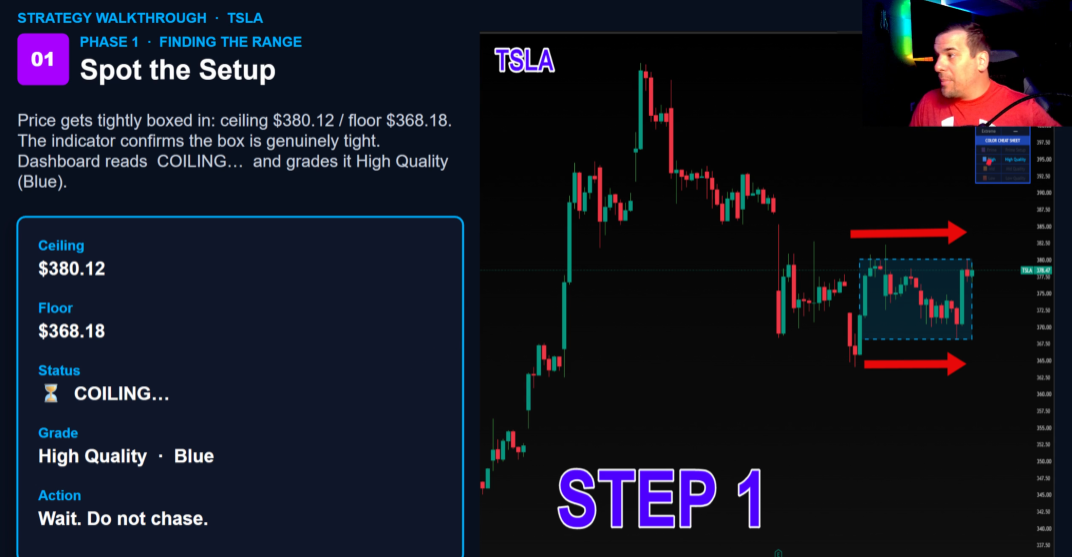
During this workshop, I walk you through the exact three-phase framework we use to identify where institutional capital is trapped.
Here is exactly what we break down on the charts:
👉 Phase 1 (Spotting the Setup): How to identify the exact moments TSLA or AAPL coil up before a massive directional release.
👉 Phase 2 (The Breakout): The precise trigger rules we use to enter the trade as the box breaks.
👉 Phase 3 (Managing the Trade): How to set clear target exits and protect your capital if the market shifts.
👉 The 4 Quality Tiers: Why we categorize setups into Prime, High, Mid, and Low quality so you only focus on the absolute best opportunities.
I also pull up live charts of TSLA and AAPL to show you exactly how the indicator automatically plots these zones on your screen.
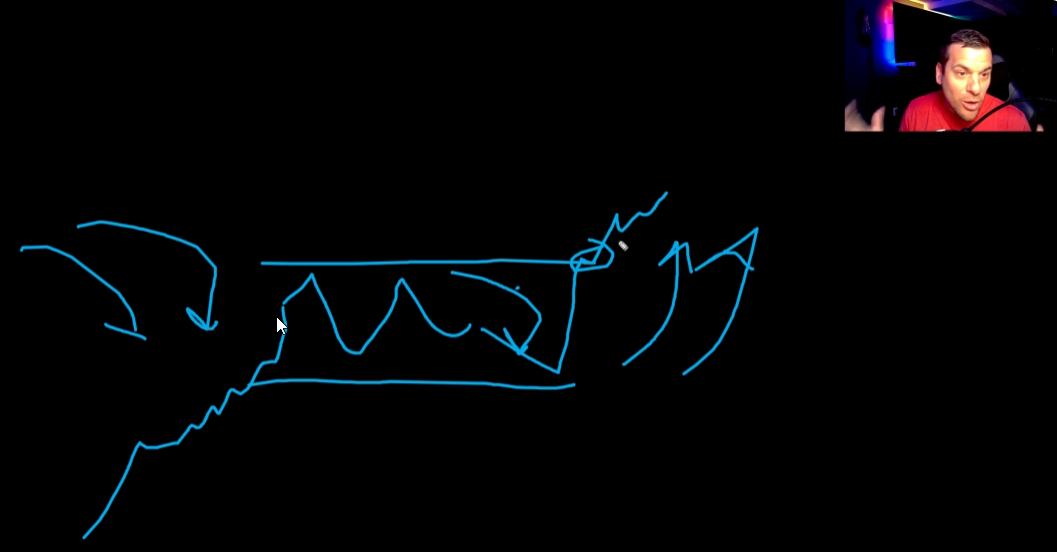
This is the exact same process I use every single day to find clean, structured breakout setups without staring at charts for hours.
You can watch the entire system in action and copy the layout for your own charts today.
Talk soon,
Ben | Find Better Trades
P.S. There is no pitch timer, no artificial delay, and no registration required to view this.
Just click here to stream the full BreakerBox+ breakdown and see how we map out these institutional traps on your charts.