wholesale prices and my breakout blueprint
US wholesale prices just ticked up again as climbing oil prices keep inflation incredibly stubborn.
This persistent macro pressure means we are likely going to see a lot of sudden, sharp moves in the broad market.
It also means there could be some exceptionally clean breakout trades setting up for tomorrow.
To navigate these quick moves, you need a rule-based way to spot where institutional capital is trapping retail traders.
I recently recorded a complete, step-by-step strategy breakdown of the entire BreakerBox system to show you exactly how to do this.
You can watch this on-demand masterclass right now without any registration process.
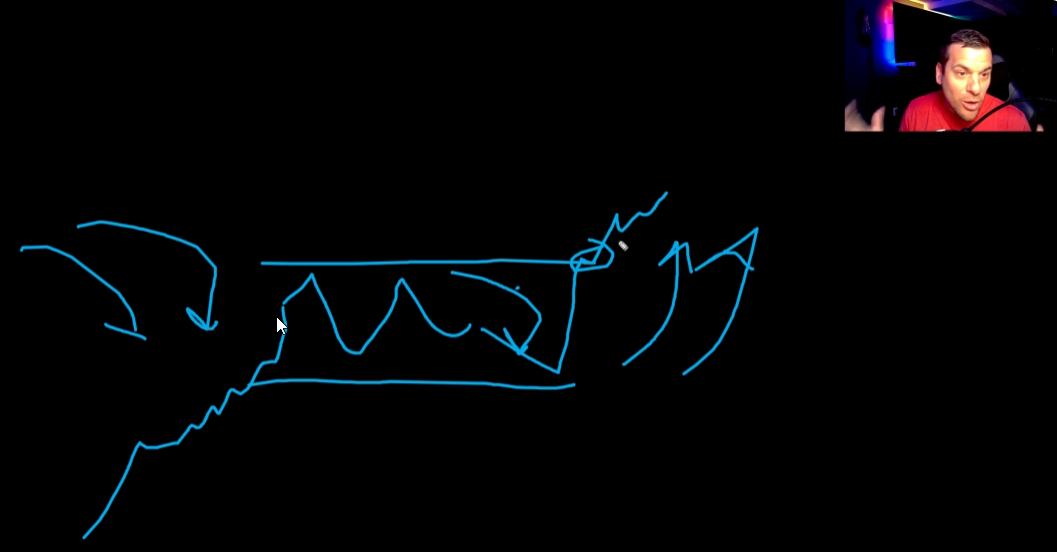
During this deep dive, I mark up real charts to show you how the indicator identifies trapped energy before a breakout occurs.
You will see how we spot the initial setup in Phase 1, capture the breakout in Phase 2, and manage the trade in Phase 3.
I also break down the four setup quality tiers so you can easily distinguish a Prime trade from a low-quality trap.
This strategy is designed to work across multiple different assets, and I walk through real-world charts of TSLA and AAPL during the session.
If you want to see the system in action on real historical charts, this walkthrough will give you everything you need.
Click here to stream the free workshop now.
Talk soon,
Ben | Find Better Trades
P.S. Sticky inflation means we are headed for a stock picker's market where broad index funds might struggle.
Knowing how to target specific, high-momentum breakouts is going to be a vital skill in the coming weeks.
👉 Stream the complete strategy breakdown here to prepare your game plan.