I stopped drawing manual lines on my charts
I spent years manually drawing horizontal lines on my charts to track where major institutions were hiding their orders.
You kept asking me for a cleaner, automated way to find these tight consolidation zones without cluttering your screen.
We finally built it, and today you can finally get your hands on the finished system.
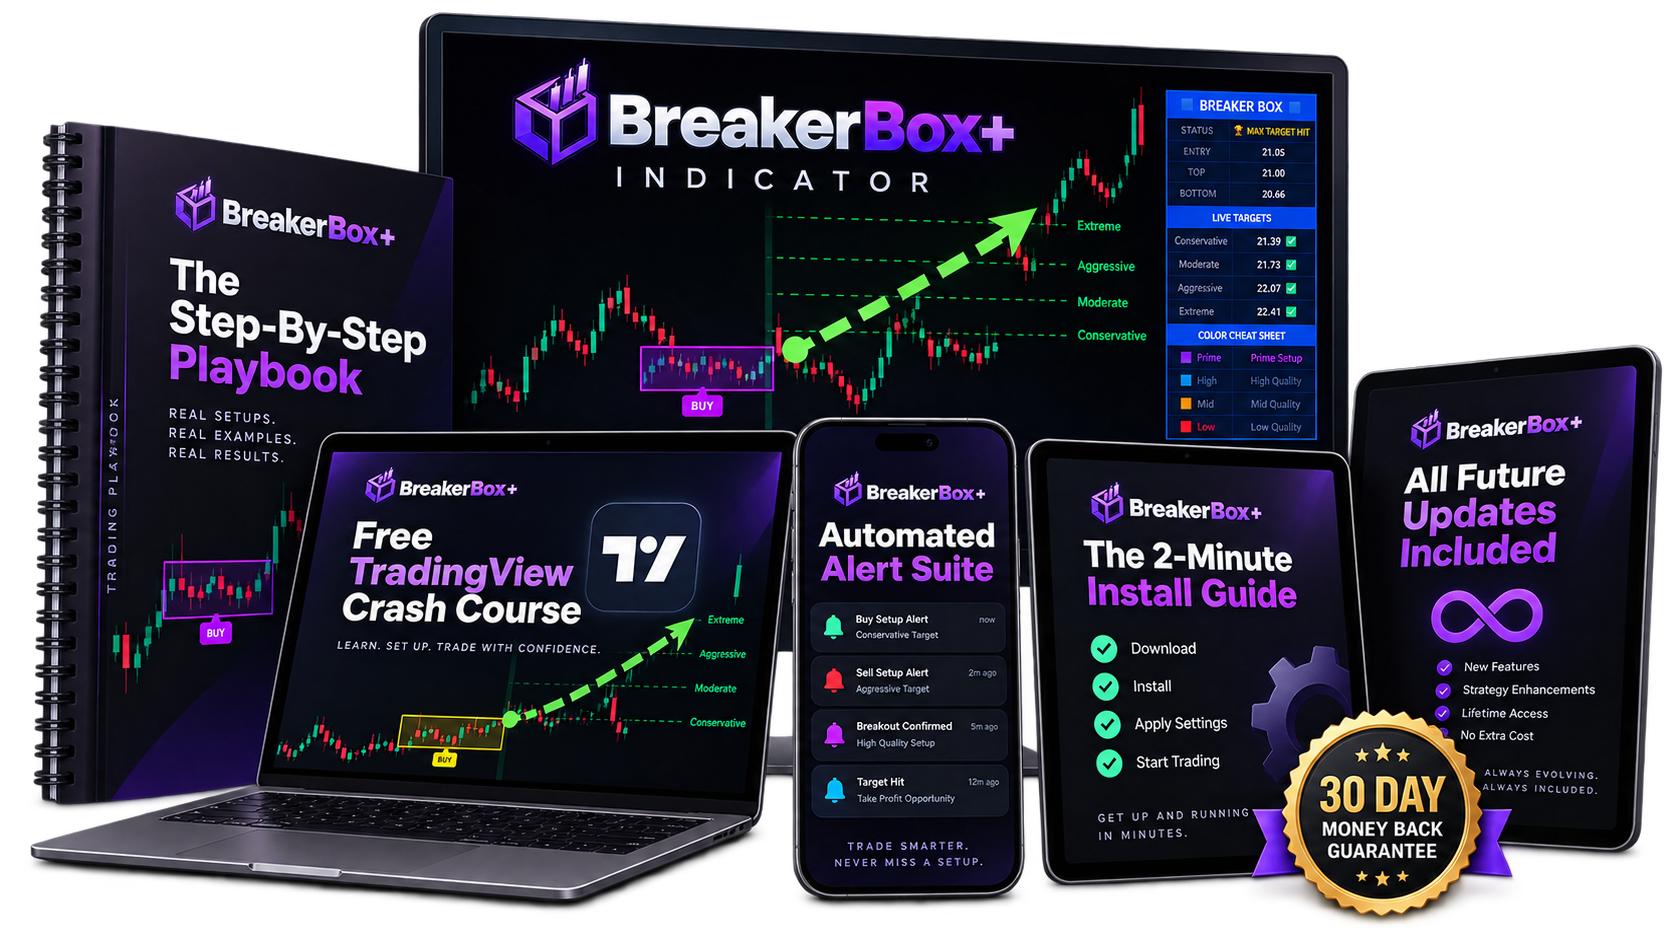
It is called BreakerBox+, and it completely automates how you view market compression.
Instead of manually trying to find key ranges, this indicator automatically draws a clean box around the quiet, resting phases of the market.
When the price finally breaks out of that box, the system fires a highly accurate signal.
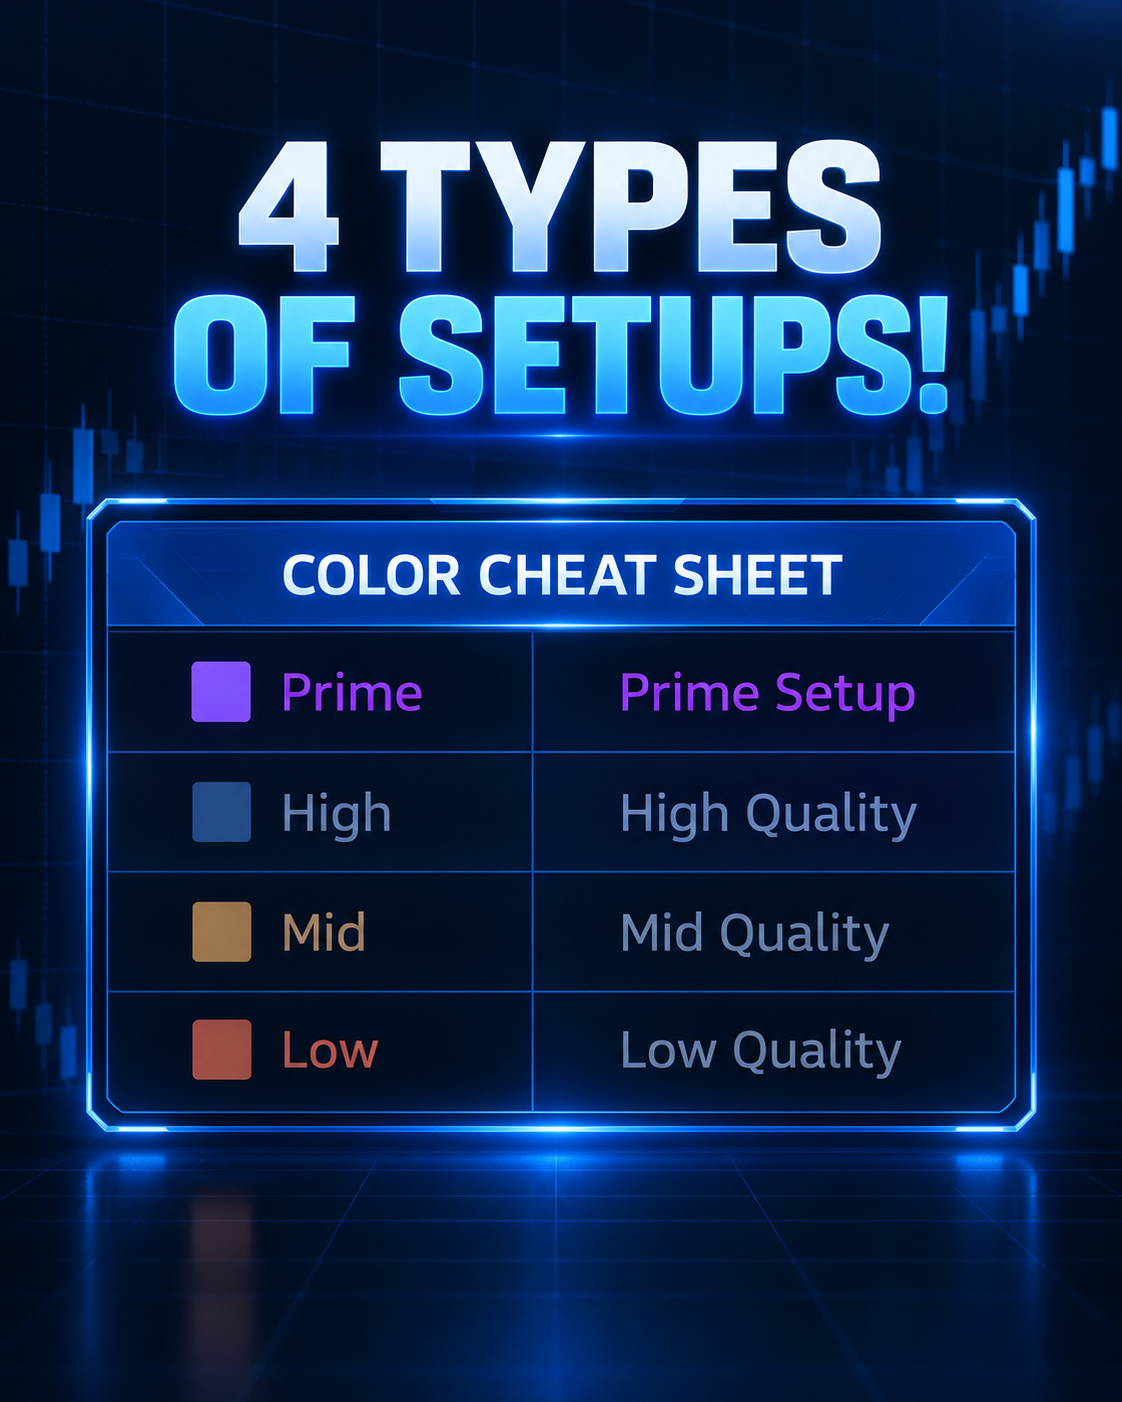
To make things incredibly simple, the algorithm automatically grades every single breakout into four distinct quality tiers.
You will instantly see whether a setup is Prime, High, Mid, or Low quality directly on your chart.
This means you can instantly ignore the weak, choppy moves and focus all your energy on the highest-probability setups.
The indicator even calculates and plots your exact target levels automatically based on the size of the consolidation box.
It works beautifully across stocks like TSLA and HOOD, as well as crypto, forex, and futures.
I want to make sure you get early access to this system before we release it to the general public.
You can grab your lifetime license to the indicator right now at a major early-bird discount.
Get BreakerBox+ Lifetime Access Here
If you want to see exactly how these four tiers look on a live chart, go check out the full breakdown page.
👉 Click here to get instant access to BreakerBox+ now.
Talk soon,
Ben | Find Better Trades
P.S. Once this initial launch window closes, the price is going up significantly.
Grab your copy today and start finding cleaner breakout trades tomorrow.